You are here
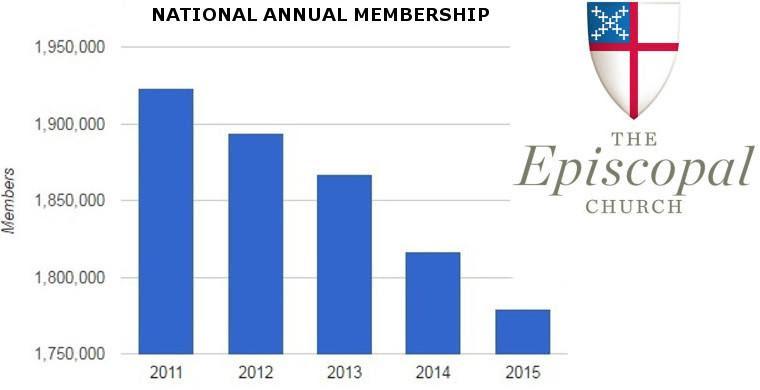
Newly-released Episcopal Church bar graphs reveal continued membership loss in 2016
Preliminary data shows downward creep continuing
By Mary Ann Mueller
VOL Special Correspondent
www.virtueonline.org
September 8, 2017
September not only means a lowering of temperatures, possible late summer hurricanes threatening the US coastline, and the beginning of colorful fall foliage, it also signals the time when The Episcopal Church starts releasing its latest membership figures. This preliminary information, for the calendar year ending December 31, 2016, was released in the form of colorful blue (baptized membership), red (ASA), and green (plate & pledge) diocesan participation bar graphs used to visualize changes in membership, average Sunday attendance and plate & pledge over a 10-year period.
The 14 dioceses which seem to have an increase of baptized membership include: Alabama, Delaware, Fond du Lac, Hawaii, Idaho, Nebraska, Nevada, North Carolina, North Dakota, TEC Pittsburgh, TEC San Joaquin, Tennessee, Utah, and Western Kansas.
Another 68 dioceses showed a discernible drop in membership including: Alaska, Albany, Arizona, Arkansas, Bethlehem, California, Central Florida, Central Gulf Coast, Central New York, Central Pennsylvania, Chicago, Colorado, Connecticut, Dallas, East Tennessee, Eastern Michigan, Eastern Oregon, Easton, El Camino Real, Florida, Georgia, Indianapolis, Iowa, Kansas, Kentucky, Lexington, Los Angeles, Louisiana, Maine, Maryland, Massachusetts, Michigan, Milwaukee, and Minnesota, Mississippi, Missouri, Navajoland, New Hampshire, New Jersey, New York, Newark, Northern California, Northern Indiana, Northern Michigan, Northwest Texas, Ohio, Oklahoma, Olympia, Oregon, Rochester, San Diego, Southeast Florida, Southern Ohio, Southern Virginia, Southwest Florida, Southwestern Virginia, Spokane, Springfield, Upper South Carolina, Vermont, Virginia, Washington DC, Western Missouri, West Texas, Western Louisiana, Western Massachusetts, Western Michigan, and Western New York.
An initial perusal of the newly-released graphs reveals some changes in baptismal numbers, ASA and P&P income are so small that they do not show up in the bar graph.
The 16 dioceses that show a minute membership bar graph movement and are too close to call include: Atlanta, East Carolina, Eau Claire, TEC Fort Worth, Long Island, Montana, Northwestern Pennsylvania, Pennsylvania, Rhode Island, Rio Grande, South Dakota, Texas, West Tennessee, West Virginia, Western North Carolina and Wyoming.
The Episcopal Church is showing a continuing slow and steady downward trend. Declining numbers no longer reflect the massive flood of Episcopalians who left the denomination over women's ordination, the acceptance of homosexual marriage or the full embrace of transgenderism.
Five entire dioceses left TEC, led by San Joaquin in 2007, followed by Pittsburgh, Fort Worth, and Quincy in 2008; and finally, South Carolina in 2012. Thousands of other Episcopalians also left on an individual basis, leaving Episcopal churches to empty. Now, The Episcopal Church reflects a natural attrition where more Episcopalians are being buried than baptized and confirmed or moving away and not affiliating with the local Episcopal church in their new neighborhoods, leaving fewer people in the pews.
For a fifth year in a row, The Episcopal Church has not developed a bar graph for The Episcopal Church IN South Carolina, so only 98 out of TEC's 99 domestic dioceses are reflected in the graphs. In 2012, the Episcopal Diocese OF South Carolina disaffiliated with the Episcopal General Convention and has since joined the Anglican Church in North America. Five years later, the now ACNA diocese is still battling in the courts for its churches and corporate name.
The 100th domestic Episcopal diocese -- Quincy -- reunited with the Diocese of Chicago to become the Peoria Deanery in 2012. It is no longer represented by TEC's yearly participation bar graphs.
However, 11 of TEC's dioceses which seemed to show an ASA uptick in 2016 are: Georgia, Navajoland, Nebraska, Northwest Texas, Northwestern Pennsylvania, Ohio, Oklahoma, Vermont, Washington DC, Western Kansas, and Western New York.
Some 54 dioceses which showed a downward trend in Average Sunday Attendance (ASA) include: Alaska, Albany, Arizona, Bethlehem, California, Central Gulf Coast, Central New York, Central Pennsylvania, Colorado, Connecticut, Delaware, East Tennessee, Eastern Michigan, Easton, Eau Claire, El Camino Real, Florida, Fond du Lac, Hawaii, Idaho, Iowa, Kansas, Kentucky, Lexington, Long Island, Los Angeles, and Louisiana, Maine, Maryland, Milwaukee, Minnesota, Missouri, New Hampshire, Newark, North Dakota, Northern California, Northern Indiana, Oregon, Rio Grande, San Diego, South Dakota, Southeast Florida, Southern Virginia, Southwest Florida, Southwestern Virginia, Spokane, Upper South Carolina, Utah, West Missouri, West Texas, West Virginia, Western Louisiana, Western Massachusetts, Western Michigan.
However, there are 33 TEC dioceses whose increase or decrease in ASA numbers cannot be visually determined until the actual 2016 figures are made public. They include: Alabama, Arkansas, Atlanta, Central Gulf Coast, Chicago, Dallas, East Carolina, Eastern Oregon, TEC Fort Worth, Indianapolis, Massachusetts, Michigan, Mississippi, Montana, Nevada, New Jersey, New York, North Carolina, Olympia, Pennsylvania, TEC Pittsburgh, Rhode Island, Rochester, Northern Michigan, TEC San Joaquin, Southern Ohio, Springfield, Tennessee, Texas, Virginia, West Texas, Western North Carolina, and Wyoming.
Plate and pledge income for 2016 is also a mixed bag, with little more than a third of domestic Episcopal diocese showing an offering plate increase. The 37 dioceses are: Alabama, Atlanta, California, Central Florida, Central Gulf Coast, Dallas, Delaware, East Carolina, East Tennessee, El Camino Real, Florida, Fond du Lac, TEC Fort Worth, Hawaii, Kentucky, Maryland, Massachusetts, Mississippi, and Nebraska.
Also: North Carolina, Northern California, Ohio, Olympia, Oregon, Rhode Island, Rio Grande, Rochester, TEC San Joaquin, Southern Virginia, Southwest Florida, Spokane, Springfield, Tennessee, Virginia, West Tennessee, Western Michigan, and Wyoming,
The 48 TEC dioceses showing a decrease in plate and pledge include: Alaska, Albany Arkansas, Bethlehem, Central New York, Central Pennsylvania, Chicago, Colorado, Connecticut, Eastern Michigan, Eastern Oregon, Easton, Eau Claire, Idaho, Indianapolis, Iowa, Lexington, Long Island, Los Angeles, Louisiana, Maine, Michigan, Milwaukee, and Minnesota, Montana, Nevada, New Jersey, New York, Newark, North Dakota, Northern Indiana, Northern Michigan, Northwestern Pennsylvania, Oklahoma, San Diego, South Dakota, Southwestern Virginia, Texas, Upper South Carolina, Vermont, Washington DC, Western Missouri, West Texas, West Virginia, Western Kansas, Western Louisiana, Western Massachusetts, and Western New York.
The remaining 13 TEC dioceses with a relatively flat plate and pledge graphic include: Arizona, Georgia, Kansas, Missouri, Maryland, New Hampshire, Northwest Texas, Pennsylvania, TEC Pittsburgh, Southeast Florida, Southern Ohio, Utah, and Western North Carolina.
Past history shows that actual figures are needed to flesh out the visual thumb nail bar graphs. These figures will be released by The Episcopal Church later in late September.
Mary Ann Mueller is a journalist living in Texas. She is a regular contributor to VirtueOnline